
The energy use of electronic equipment often goes unnoticed. But as it turns out, an estimated 10% to 15% of 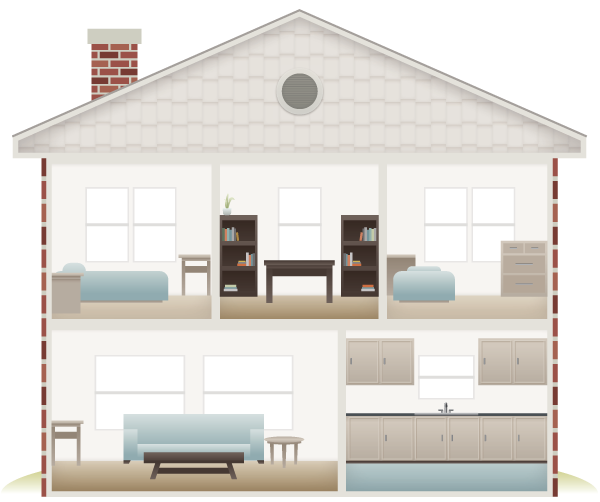 all electricity used in American homes can be attributed to the buzz of electronic devices. The vast majority is consumed by home entertainment systems and home office equipment. But small energy users, including portable devices with battery chargers, make up a significant share—not because they use a lot of energy individually, but because of their sheer numbers.
Below is a table of common electronic equipment and the average energy used in each mode and per year (in order from most energy-intensive to least)
| Product |
Passive Standby or Off (watts)
|
Active Standby
(watts) |
Active
(watts) |
Average Annual Energy Use (kWh)
|
| Home Entertainment | ||||
| Plasma TV (<40″) |
3
|
–
|
246
|
441
|
| DVR/TiVo |
37
|
37
|
37
|
363
|
| Digital Cable |
26
|
26
|
26
|
239
|
| Satellite Cable |
12
|
11
|
16
|
124
|
| CRT TV (<40″) |
1
|
–
|
73
|
123
|
| LCD TV (<40″) |
3
|
–
|
70
|
77
|
| Video Game Console |
1
|
–
|
24
|
16
|
| DVD |
1
|
5
|
11
|
13
|
| Home Office | ||||
| Desktop Computer |
4
|
17
|
68
|
255
|
| Laptop Computer |
1
|
3
|
22
|
83
|
| CRT Monitor |
2
|
3
|
70
|
82
|
| LCD Monitor |
1
|
2
|
27
|
70
|
| Computer Speakers |
2
|
–
|
7
|
20
|
| Modem |
5
|
–
|
6
|
50
|
| Wireless Router |
2
|
–
|
6
|
48
|
| USB Hub |
1
|
–
|
3
|
18
|
| Printer |
2
|
3
|
9
|
15
|
| Fax |
4
|
4
|
4
|
26
|
| Multi-Function Printer/Scanner/Copier |
6
|
9
|
15
|
55
|
| Rechargeable Devices | ||||
| Power Tool |
4
|
–
|
34
|
37
|
| Hand-Held Vacuum |
3
|
–
|
3
|
29
|
| Cordless Phone |
2
|
3
|
5
|
26
|
| Electric Toothbrush |
2
|
–
|
4
|
14
|
| Shaver |
1
|
–
|
1
|
11
|
| MP3 Player |
1
|
–
|
1
|
6
|
| Cell Phone |
0
|
1
|
3
|
3
|
| Digital Camera |
0
|
–
|
2
|
3
|
Source: ECOS Consulting, 2006: Final Field Research Report for the California Energy Commission
As an extra help, check out this interactive energy calculator that helps you determine how much energy your electronics and appliances consume, even when they are not in use.


